There’s always been a bit of a gap in coaching.
Not in the experience itself; leaders feel the impact. They grow, they think differently, they show up in new ways.
The gap is in the visibility.
What’s actually happening across your programs?
Who’s engaged?
Where is momentum building or stalling?
And how do you show that to the people who are investing in it?
That’s the problem we set out to solve with Optify Dashboards, and we’re excited to share that they’re now live.
See Dashboards In Action
Dashboards give you a clear, real-time view of your coaching programs in a way that just hasn’t been possible before. You can see how leaders are engaging, how sessions are pacing, and where attention is needed, all in one place. No pulling data from multiple sources. No stitching together reports. It’s just there, ready to use.
And once you can actually see what’s happening, everything gets easier. You can step in before someone disengages. You can spot patterns across teams or cohorts. You can make decisions based on what’s real, not what you hope is happening.
We’ve also seen how this changes the internal conversation. Instead of chasing updates or summarizing activity for stakeholders, you can share a clear, current picture of your programs—what’s working, where things are gaining traction, and where to focus next. It brings a level of alignment that’s been hard to achieve until now.
New: Survey Dashboards
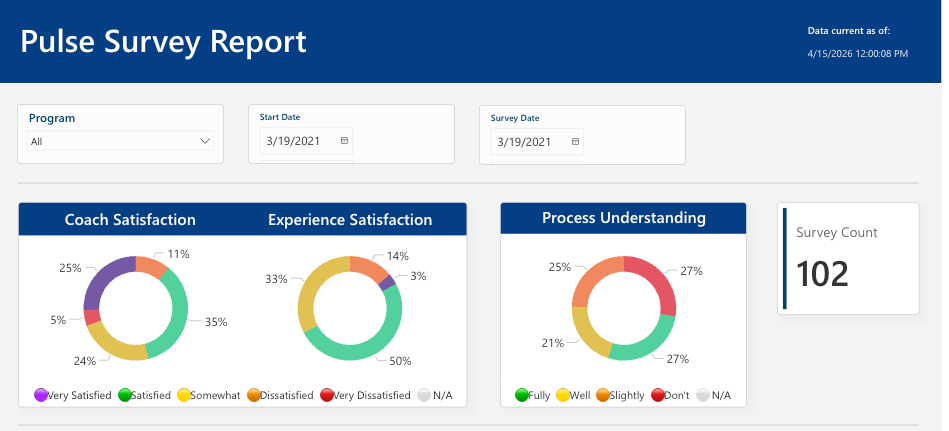
Alongside this, we’ve introduced Survey Dashboards, which bring participant feedback into the same experience. If you’ve ever had survey data sitting in a spreadsheet somewhere, this will feel like a meaningful shift. Now you can see trends in how people are experiencing coaching, identify issues early, and follow up in a way that’s timely and targeted.
Optify’s new survey dashboards give organizations a clearer, more actionable view into coaching and leadership development feedback. Whether teams are already using Optify surveys, relying on external tools, or not yet capturing meaningful feedback at all, the new dashboards make it easier to measure trends, surface insights, and demonstrate impact over time.
At the end of the day, these updates are about helping you spend less time pulling information together and more time improving your programs. It’s about giving you the clarity to move faster and the confidence to know where to focus.
Get Started Now
Dashboards are now available to Optify customers, and we’re excited to see how teams start using them.
If you’re already an admin on the platform, take a look and explore what’s new. And if you’re thinking about how to scale coaching or want a better way to understand what’s working, we’d love to connect and show you how it all comes together.